Defining a Vision for 2030
Globally, the biggest contributing factor to climate change is the burning of fossil fuels. In the UK energy supply sector, business and residential use account for 56% of GHG emissions while transport accounts for 28%. In total the burning of fossil fuels in the UK accounts for nearly 85% of all our GHG emissions. In this chapter, we focus primarily on grid energy supply (i.e. not transport) although it is important to note that the shift from internal combustion engines to electric vehicles will create additional demand on the grid. We will address this in part in the Travel Better chapter. To reach net zero as rapidly as possible, we need to electrify virtually everything (in particular heating for buildings and transport), providing this entirely from renewables. While fossil fuel use is the principal cause of climate change, at the heart of environmental breakdown is the separation of nature from human activity. Over recent centuries our supposed ‘domination’ of nature, as a commodity to be tamed and exploited, has been instrumental in creating the issues we now face. In our use of energy this manifests itself in the notion of ‘somewhere else’ cause and effects, with both the production of energy and the subsequent damage it causes taking place out of sight, and often out of mind. As with nature itself, there is an opportunity to reconnect with where energy comes from. This chapter, therefore, as well as looking at the technical challenge and statistics, seeks to define a vision where we can actually see the source of our energy production here in Dorset, and in doing so, asks us to reconnect with how we power our lives for the first time since the birth of the industrial age.
In 2030...
All Dorset’s energy needs are provided by renewable sources, all of them situated within the county’s boundaries or offshore. The transition has been just, equitable and produced wider benefits to residents, including the creation of local jobs and lower bills.
Most energy production is owned by the community through various mechanisms: Council-controlled installations that return profits to residents through reduced local taxes, mutual organisations who return profits to members, direct community ownership, and homeowners themselves.
The link between energy requirements (for example how many wind turbines we need) and our energy usage is clearly understood, supporting the on-going efforts of businesses, the public sector, communities, and individuals to reduce their energy demand.
No biofuels or any other ‘renewable’ technologies are employed that require imported materials or are in some other way damaging to eco-systems.
Assessment Framework
How are we performing currently?
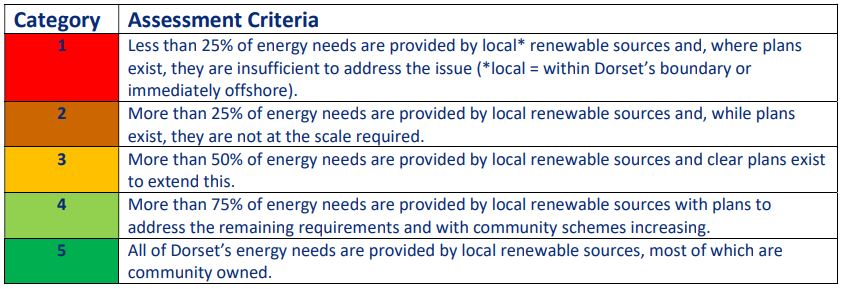
The framework below sets out the criteria against which the current status can be assessed. Aspirational objectives are then set to encourage progress towards the vision.
The framework below sets out the criteria against which the current status can be assessed. Aspirational objectives are then set to encourage progress towards the vision.
2021 Assessment
|
Where are we now and what else do we need to know?
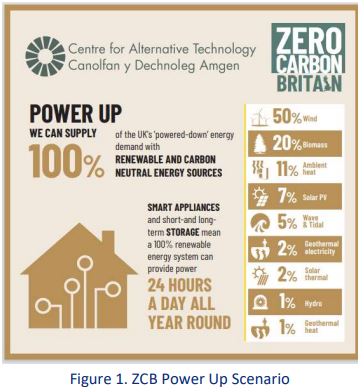
The Zero Carbon Britain (ZCB) scenario shows how, subject to appropriate reductions in energy demand, we could provide all of our energy using only renewable sources, with no nuclear. Based on extensive analysis of historic weather patterns (wind speed, sun hours) and considering all the available technologies (including those that would be needed to meet demand during times of inadequate wind and/or sun), the split of provision shown in Figure 1 would provide this 100% coverage across the UK. In October 2021, the UK Government announced, as part of its Net Zero Strategy129, that all UK electricity will come from ‘clean energy sources’ by 2035. This broad commitment is a welcome one. However, the inclusion of nuclear and the seemingly contradictory figure of a residual 15-20% of emissions suggests the commitment to rapid decarbonisation and move to full renewable deployment is still lacking. |
Nationally, targeted provision of energy to the grid previously assumed approximately half of this will come from offshore wind farms, leaving the remainder to be provided locally. For this assessment, the starting point is that, because a site has been identified within Poole Bay in which an offshore wind farm could be located, we have the potential to produce all our energy locally. Figure 1. ZCB Power Up Scenario Page 75 Of course, Dorset doesn’t have to produce all of its power within the county boundaries but, as set out above, the aim here is to develop an understanding of what our energy demands look like in terms of generating power, to assess what is possible and to create that connection and awareness. As we will outline below, not only is this possible but producing all our energy locally also brings additional benefits. Dorset’s current energy needs (as shown in the table and chart below) are estimated to be around 14,000 GWh130; businesses and residential are the county’s two largest sources of GHG emissions (after transport), contributing 60% of the total when combined. Work in the ZCB report (as outlined in the Power Down chapter) proposes we should reduce our energy demand by 60%. In line with this, for this chapter the targeted energy requirement is based on this reduced level of 5,600 GWh (which would also cover the electricity required for transport). Energy consumption has decreased steadily over the last decade, with total demand over 7% lower than in 2010. Total energy demand per person in Dorset is 23 MWh. Three quarters of this demand is met through fossil fuels, predominantly natural gas for heating and petroleum for vehicles

